
AI Dashboard Generator
Build a dashboard from your table with editable charts, KPI cards, and AI chart suggestions. Review each chart and arrange the layout for your report.
AI suggestions help with the chart you are editing. You choose the charts, KPI calculations, and dashboard layout.
Fictional sample data
See a dashboard built from one table
This fictional sales dashboard uses one table for a total-revenue KPI, a monthly revenue trend and revenue by category. Both charts and the KPI calculate from the same rows. Load the preset to explore and edit it without using AI credits.
| month | category | revenue |
|---|---|---|
| 2026-04 | Subscriptions | 18000 |
| 2026-04 | Consulting | 12000 |
| 2026-05 | Subscriptions | 22000 |
| 2026-05 | Consulting | 14000 |
| 2026-06 | Subscriptions | 26000 |
| 2026-06 | Consulting | 16000 |
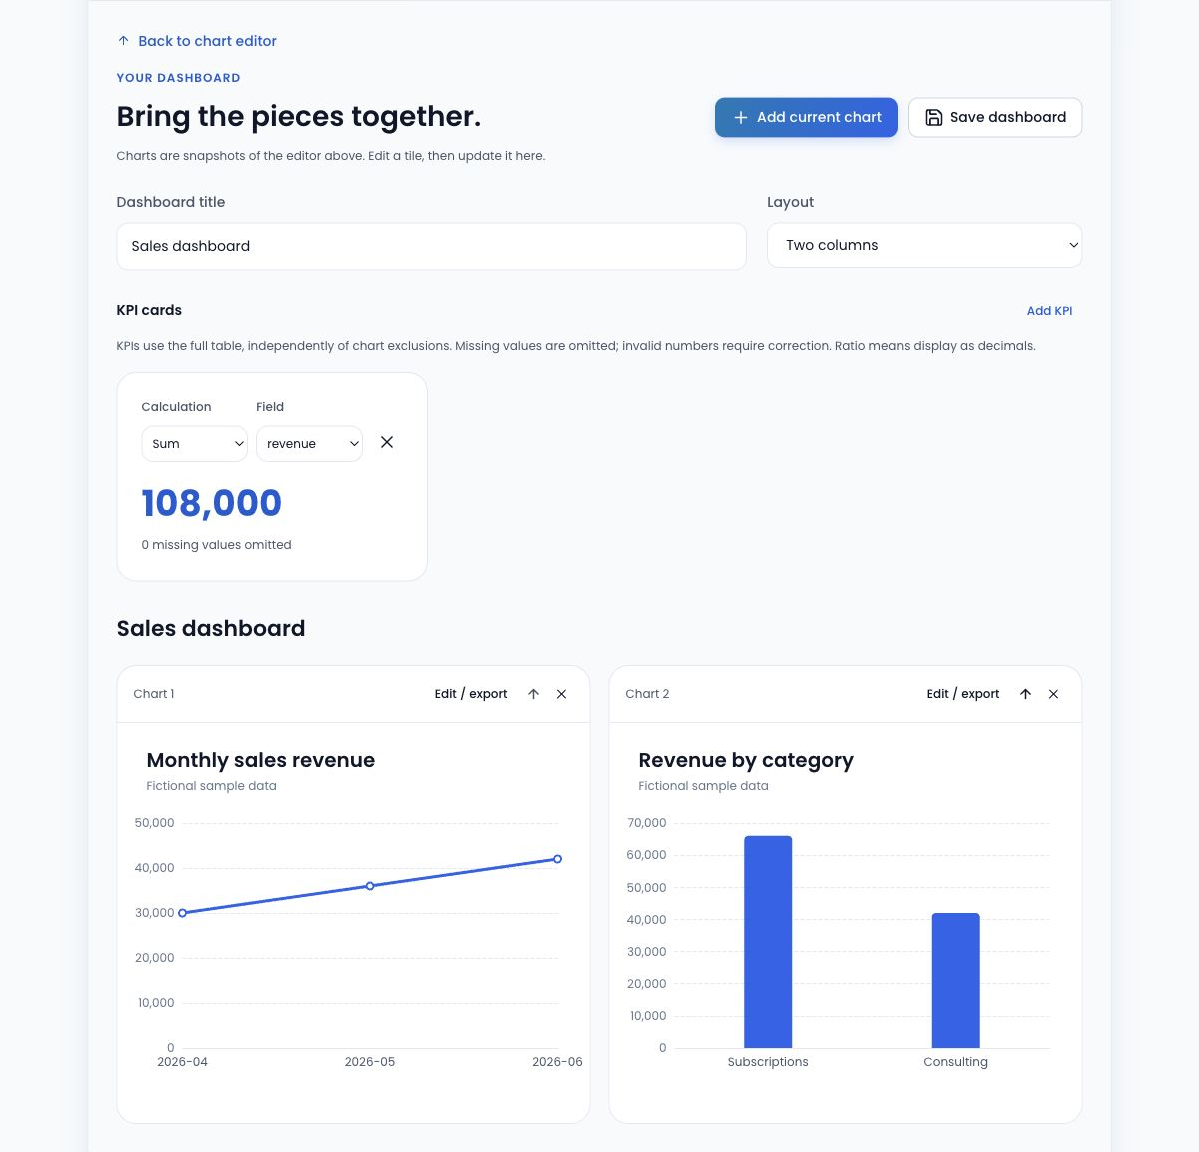
HOW TO USE THIS TOOL
How to build a dashboard with AI chart suggestions
Review one source table
Import CSV or TSV, or paste spreadsheet values. Check headers, numeric formats and repeated categories.
Create and add charts
Configure a chart manually or review an AI suggestion for that chart, then add it to the dashboard. Repeat for up to six charts.
Choose KPI calculations
Add up to three KPI cards. Count rows, sum a numeric field or calculate its mean, and review missing-value counts.
Arrange and save
Choose one or two columns and reorder your charts. Download the dashboard project to preserve its table, charts, KPI settings and layout.
Combine charts and KPI cards
Use a line chart to follow revenue over time, a bar chart to compare categories, and a KPI to show a total or average. A dashboard supports up to six charts and three KPI cards from the same imported table.
KPI Count counts all table rows. Sum and Mean use the non-empty values in the selected numeric field and report missing values. Chart aggregations use each chart’s category and series choices, so review those settings when comparing a chart with a table-wide KPI.
What AI helps with—and what you control
AI suggests a starting configuration for the individual chart you are editing. It receives field names, types, row count and your instruction, not the table’s row values. You review the result and decide whether to add that chart to the dashboard.
You choose the charts, KPI calculations, chart order and one- or two-column layout. AI suggestions require an enabled service and available credits; loading the preset dashboard or building manually does not consume AI credits.
Save and reuse your dashboard
Download a dashboard project file to keep the table, chart configurations, KPI settings and layout together. Reopen it in this dashboard workspace when you want to continue editing. Keep the project file somewhere you control; your account is not a cloud project library.
Export individual charts through the chart editor. Whole-dashboard image export, public sharing links, online publishing, live refresh and linked filters are not included.
Related guides
- Line Chart vs Bar Chart: Examples and When to Use Each Compare the same monthly sales as lines and bars. Learn how ordering, missing months and equal category spacing affect the story, then edit the sample.
- Budget vs Actual Chart Example Compare Budget and Actual for four fictional departments. Inspect the difference, copy the table and open an editable two-series chart.
AI Dashboard Generator FAQ
Does AI generate the entire dashboard automatically?
No. AI suggests a configuration for the chart you are editing. You review each chart, add it to the dashboard, select KPI calculations and arrange the layout. The sample dashboard is a prepared preset and does not call AI.
Can I add multiple charts from one table?
Yes. A dashboard can contain up to six charts from its imported table. Configure each chart’s fields and summary calculation in the editor, then add it to the dashboard. Each chart can present a different view of the same rows.
How are KPI values calculated?
Each of up to three KPI cards uses Count, Sum or Mean. Count counts all rows in the table. Sum and Mean use the non-empty values of your chosen numeric field and report missing values. Invalid numeric values require review, and summing percentage fields is blocked.
Can I change the dashboard layout?
Yes. Choose a one- or two-column layout and reorder the charts with the dashboard controls. You can also change its title and KPI settings. Layout choices are preserved when you save a dashboard project.
How do I save or reopen a dashboard?
Use Save dashboard to download an editable project file containing the table, charts, KPI settings and layout. Use Open project in the dashboard workspace to reopen that file. Projects are saved locally through your browser, not to an account-based cloud library.
Can I export or share my dashboard?
You can save its editable project file and export individual charts through the chart editor. Whole-dashboard image export and public sharing links are not supported. If you pass a project file to someone else, remember that it includes the source table as well as the chart settings.