
Fictional sample data
Budget vs Actual Chart Example
Compare Budget and Actual for four fictional departments. Inspect the difference, copy the table and open an editable two-series chart.
Opens an editable preset. No AI request or credit charge.
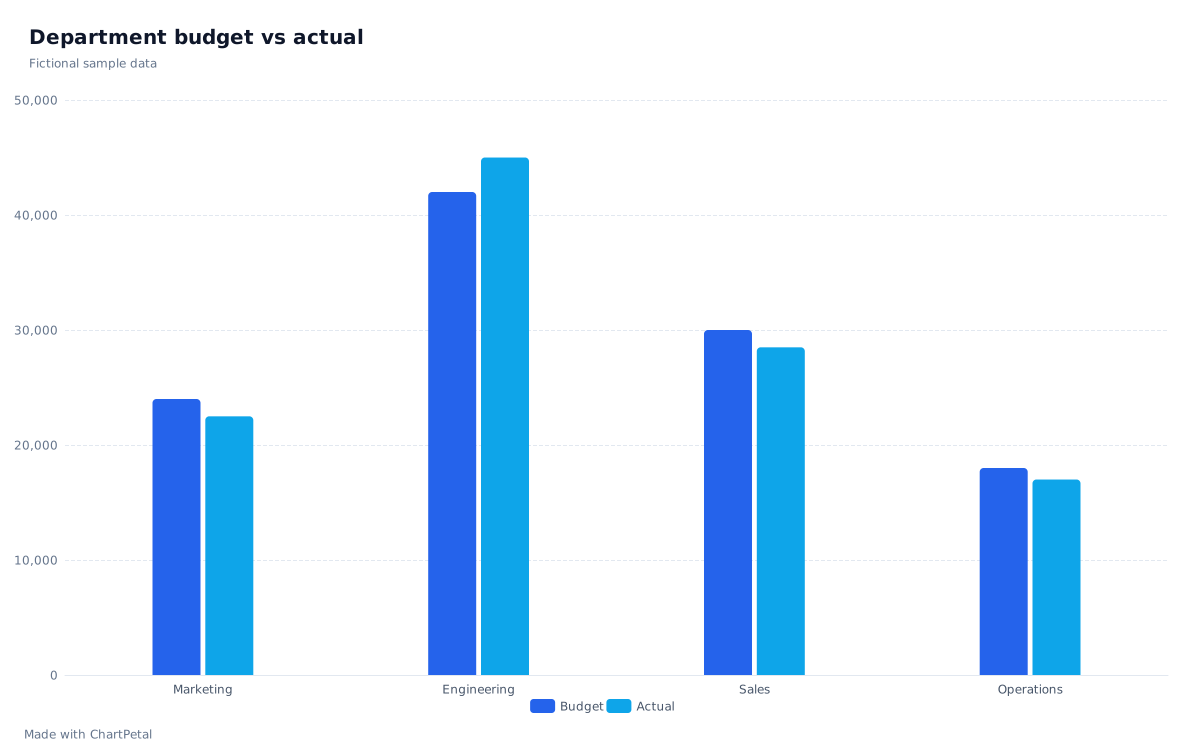
The source data
| Department | Budget | Actual | Actual − Budget | Variance (%) |
|---|---|---|---|---|
| Marketing | 24,000 | 22,500 | -1,500 | -6.25% |
| Engineering | 42,000 | 45,000 | +3,000 | +7.14% |
| Sales | 30,000 | 28,500 | -1,500 | -5% |
| Operations | 18,000 | 17,000 | -1,000 | -5.56% |
Amounts are illustrative units, not a recommended spending plan.
Calculate the difference consistently
This example treats Budget and Actual as spending for the same reporting period. Difference = Actual − Budget. Engineering has 45,000 − 42,000 = +3,000; Marketing has 22,500 − 24,000 = −1,500. Both plotted series and the calculated columns below come from the same four source rows.
Variance (%) = (Actual − Budget) ÷ Budget × 100. Engineering is +7.14%, while Marketing is −6.25%. A zero budget makes this percentage undefined; show a dash and explain the amount instead. The difference and percentage columns are explanatory calculations on this page, not extra fields silently added to your downloaded source table.
A positive difference is not always good news
For spending, a positive difference means actual cost exceeded the plan. For revenue, the same sign means actual revenue exceeded the target. Neither sign alone tells you why: timing, volume, pricing or a change in scope could matter.
Compare matching departments, periods and units. Here the totals are Budget 114,000 and Actual 113,000, but the overall difference of −1,000 hides Engineering's +3,000. Read the departmental pairs before drawing a conclusion from the total.
Build the same two-series comparison
Use this sample opens the grouped bar chart with Department selected for Category / X and both Budget and Actual selected for Values. To use your own figures, copy or download the table, replace its values in your spreadsheet, and paste or upload it into the spreadsheet tool. Review the number types, then select both numeric fields.
There is one record per department here, so Aggregation is None. If departments repeat in your source, decide whether Sum or Mean answers your question before charting. Pasted values are a snapshot; changes to the original spreadsheet do not synchronize automatically.