
AI CSV Visualization
Upload a CSV file, review its columns, and use AI suggestions to start an editable chart. Adjust your fields and summaries before exporting the result.
Fictional sample data
See a CSV file become a chart
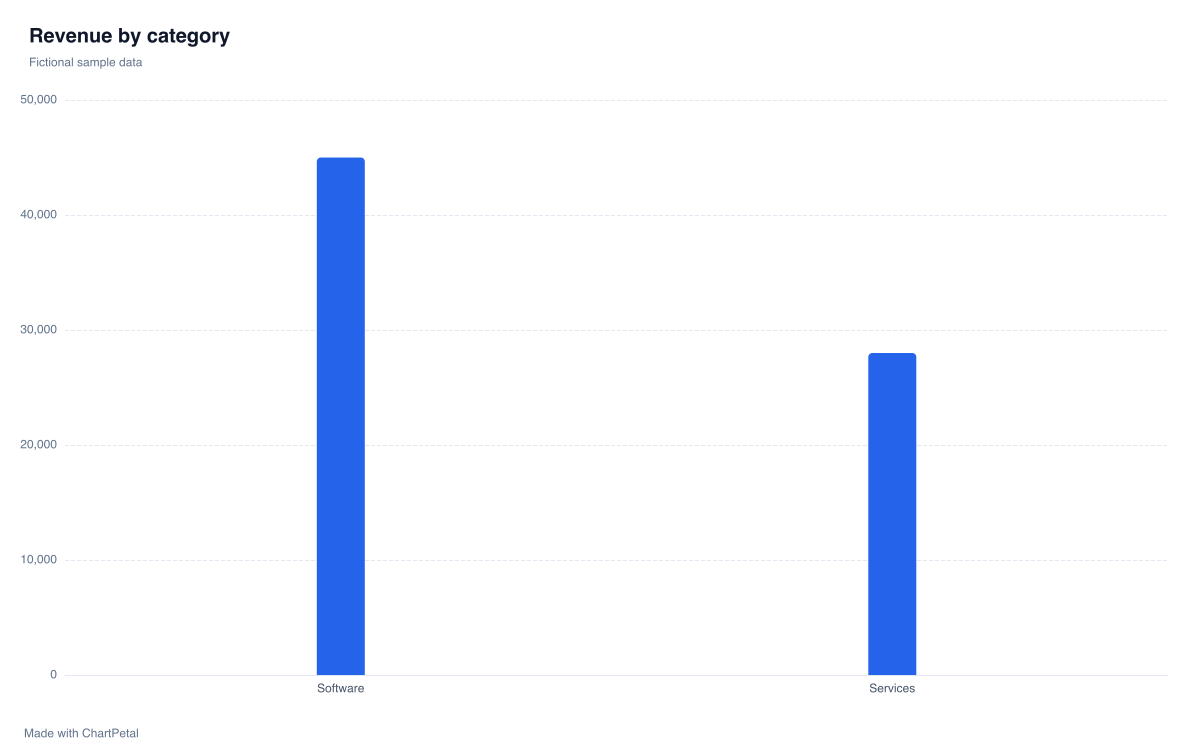
Each row in this fictional sales file records one category in one month. The chart groups repeated categories and sums revenue across months. The comparison below calculates Sum, Mean and Count from the same rows.
| month | category | revenue |
|---|---|---|
| 2026-01 | Software | 12000 |
| 2026-01 | Services | 8000 |
| 2026-02 | Software | 15000 |
| 2026-02 | Services | 9000 |
| 2026-03 | Software | 18000 |
| 2026-03 | Services | 11000 |
View the original CSV
month,category,revenue
2026-01,Software,12000
2026-01,Services,8000
2026-02,Software,15000
2026-02,Services,9000
2026-03,Software,18000
2026-03,Services,11000
HOW TO USE THIS TOOL
How to visualize a CSV file with AI
Import your file
Choose a UTF-8 CSV or TSV. Check the header option before parsing so the first data row is handled correctly.
Check columns and values
Review inferred text, number and date types. Confirm currency, thousands separators or percentage settings when your values need them.
Choose a summary
For repeated categories, explicitly choose Sum, Mean or Count. Use no aggregation only when the selected category and series identify a single row.
Suggest, refine and export
Optionally request an AI suggestion with available credits, review it and refine the chart. Export a free PNG with attribution or save an editable project.
Check your columns before creating a chart
Use non-empty, unique headers and consistent column counts. Turn off the header option if your file has no header row; columns will be named Column 1, Column 2 and so on.
Dates are recognized in YYYY-MM or YYYY-MM-DD format. Plain numbers and values ending in % can be detected as numbers. Currency symbols, thousands separators, accounting negatives and decimal commas need the matching format settings and your review.
Entirely empty rows are ignored when importing. Missing numeric values are not changed to zero: line and area charts can show gaps, and summaries omit missing numeric values. Invalid values stop chart creation unless you explicitly allow invalid rows to be excluded.
Choose how to summarize your CSV data
Sum adds the numeric values in each category. Mean averages its non-empty numeric values. Count counts rows in the category; it does not total the revenue column. Repeated categories require an explicit summary choice.
For this sample, compare the calculated results below with the summed-revenue chart. Summing percentages is blocked because adding ratios can be misleading; use Mean or no aggregation when appropriate.
| Category | Sum | Mean | Count |
|---|---|---|---|
| Software | 45,000 | 15,000 | 3 |
| Services | 28,000 | 9,333.33 | 3 |
CSV import requirements and troubleshooting
Upload .csv or .tsv files encoded as UTF-8. Comma and tab delimiters are detected from the input. The importer accepts up to 5 MB, 10,000 data rows and 2–30 columns; charts allow up to 2,000 plotted points and five series.
If import fails, check the encoding, quotation marks, duplicate or blank headers, and the number of cells in each row. A comma inside a CSV value must be quoted. If a number stays as text, review mixed values and confirm its format before changing the field type.
Formatting is reviewed explicitly. The importer does not automatically clean your dataset, fix malformed rows or detect outliers.
Related guides
- Sum vs Average: Which Should You Use in a Chart? Use the same eight sales records to compare total sales and mean sale size. See why group size changes rankings and reproduce Sum and Mean in ChartPetal.
- Bar Chart vs Histogram: Differences & Examples Compare category counts with a numeric distribution using twenty fictional deliveries. See five- and ten-minute bins and learn ChartPetal's pre-binned bar workflow.
AI CSV Visualization FAQ
How do I turn a CSV file into a chart?
Upload a CSV, parse it and review the detected fields. Choose a category and numeric value, select an aggregation if categories repeat, and create a chart manually or request an optional AI suggestion. Refine the result and download a PNG or save its editable project.
Does my CSV need a header row?
No. If it has headers, keep the header option enabled and use non-empty, unique names. If it does not, turn the option off before parsing. ChartPetal then assigns Column 1, Column 2 and subsequent numbered names without dropping your first data row.
Why is a numeric column being treated as text?
Currency symbols, thousands separators, mixed text and numbers, or leading zeros can prevent automatic numeric detection. Review the values, choose the number type and enable the appropriate number-format settings. Keep identifiers with meaningful leading zeros as text. Invalid numeric values must be corrected or explicitly excluded when charting.
How are repeated categories summarized?
You choose Sum, Mean or Count explicitly. Sum totals numeric values, Mean averages non-empty numeric values, and Count counts rows in each category. Leaving aggregation off when a category and series repeat causes an error instead of silently choosing a calculation.
What CSV file sizes are supported?
CSV and TSV input is limited to 5 MB, 10,000 data rows and 2–30 columns. A chart supports up to 2,000 plotted points and five series, with at most 100 bar categories. Reduce the input or summarize rows if your chart exceeds these limits.
Can I create a chart without using AI?
Yes. File import, field review, manual chart controls and free PNG export work without an account. AI is optional and requires an enabled service and available credits. Loading the sample CSV does not request AI or consume a credit.