
Fictional sample data
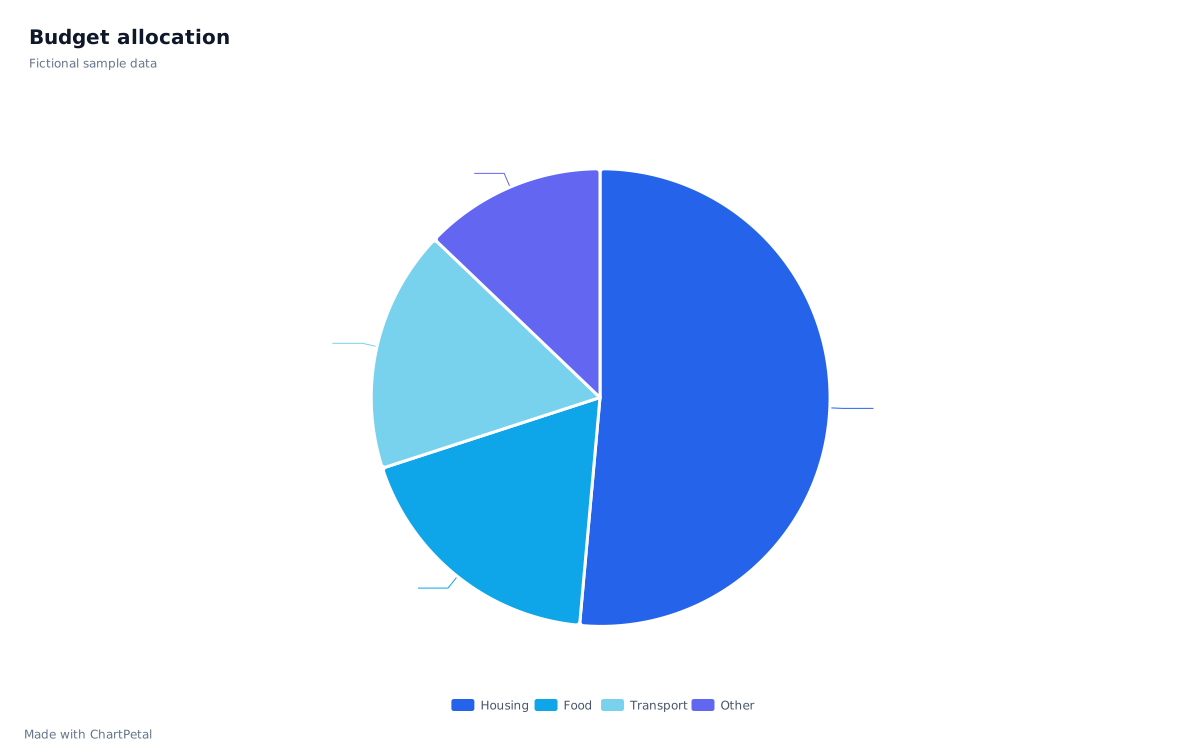
Budget Pie Chart Example
Explore a fictional budget pie chart with source data, calculated percentages and a downloadable CSV. Open the same chart in the editor.
Explore this exampleLEARN BY MAKING
Small tables, clear starting points. Open an example to inspect its data, change the chart and make it your own.
Start with a real chart and a fictional dataset. Inspect the calculations, download the source and open an editable version.
Fictional sample data
Explore a fictional budget pie chart with source data, calculated percentages and a downloadable CSV. Open the same chart in the editor.
Explore this example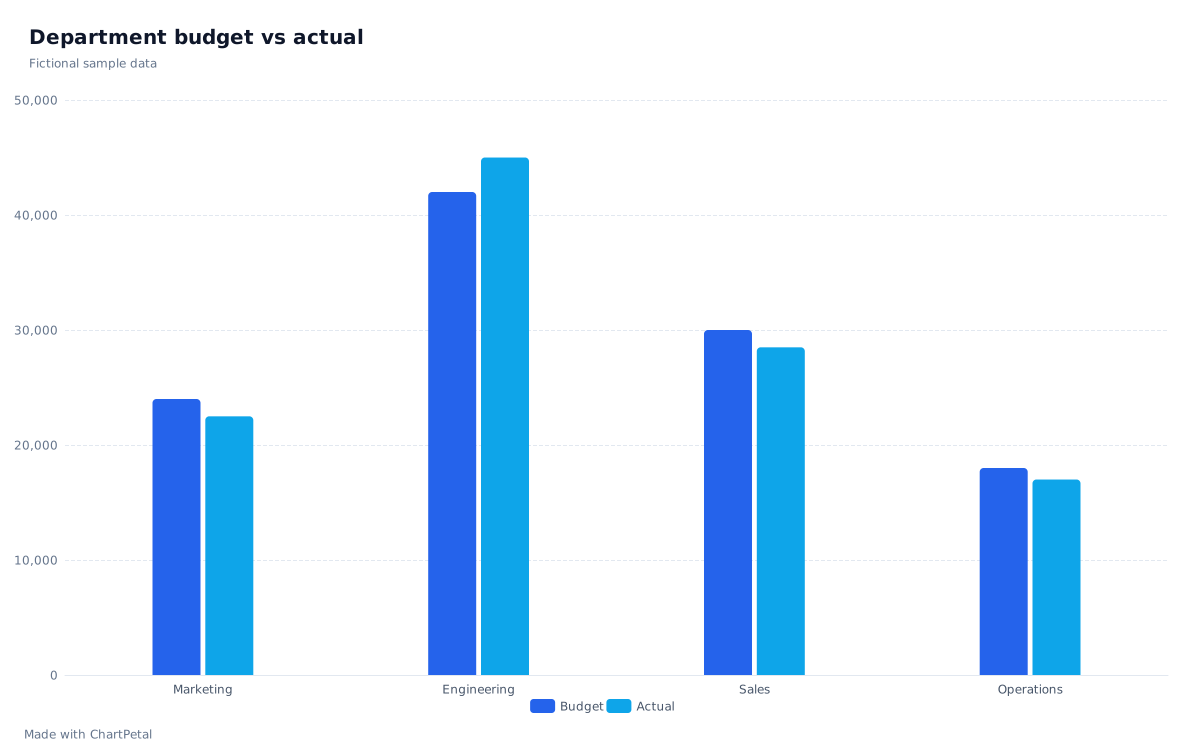
Fictional sample data
Compare Budget and Actual for four fictional departments. Inspect the difference, copy the table and open an editable two-series chart.
Explore this exampleA line chart follows monthly revenue over time. Dates keep the months in order.
Month,Revenue
2026-01,12000
2026-02,15000
2026-03,14000
2026-04,18000
2026-05,21000
2026-06,24000
A doughnut chart compares four positive parts of one marketing budget.
Channel,Budget
Search,4000
Social,2500
Content,2000
Events,1500
Horizontal bars make response labels easy to read and compare.
Response,Count
Very satisfied,42
Satisfied,35
Neutral,15
Dissatisfied,8
Examples contain illustrative data. Your edits stay on the tool page until you download a project.