Chart choice
Pie Chart vs Bar Chart: Which Should You Use?
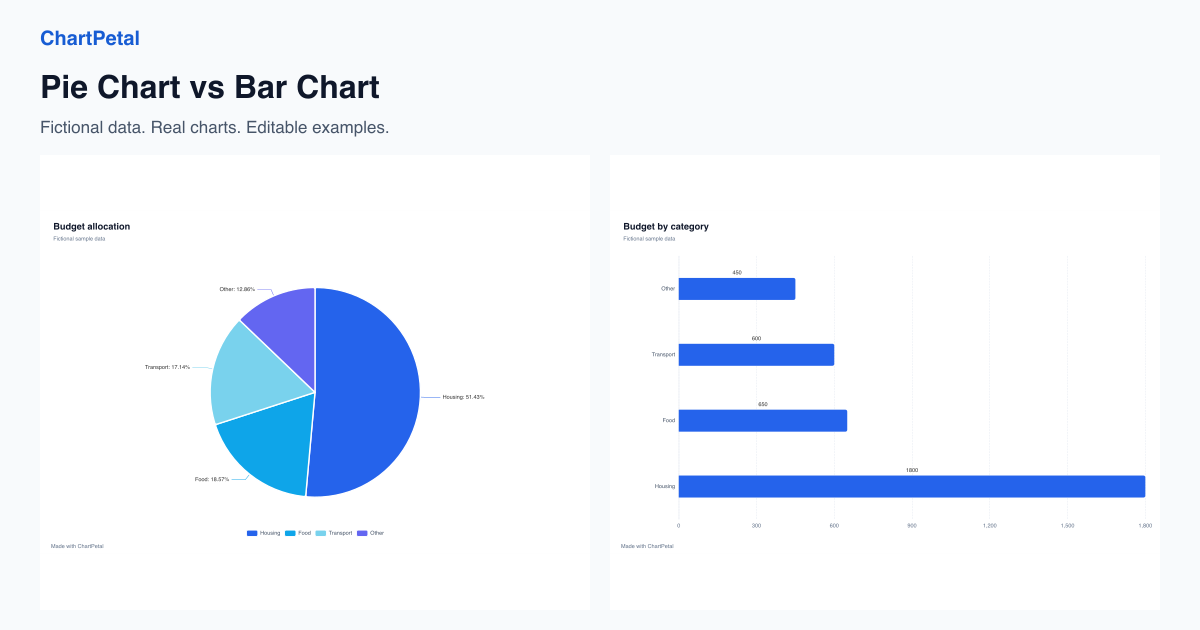
Compare a pie chart and a bar chart made from the same budget data. Learn when to show a share, compare categories or handle close values and negatives.
Read the guideBlog
Practical guides to choosing a chart, checking your data and explaining what the numbers mean. Try the same examples in the editor.
Chart choice
Compare a pie chart and a bar chart made from the same budget data. Learn when to show a share, compare categories or handle close values and negatives.
Read the guideChart choice
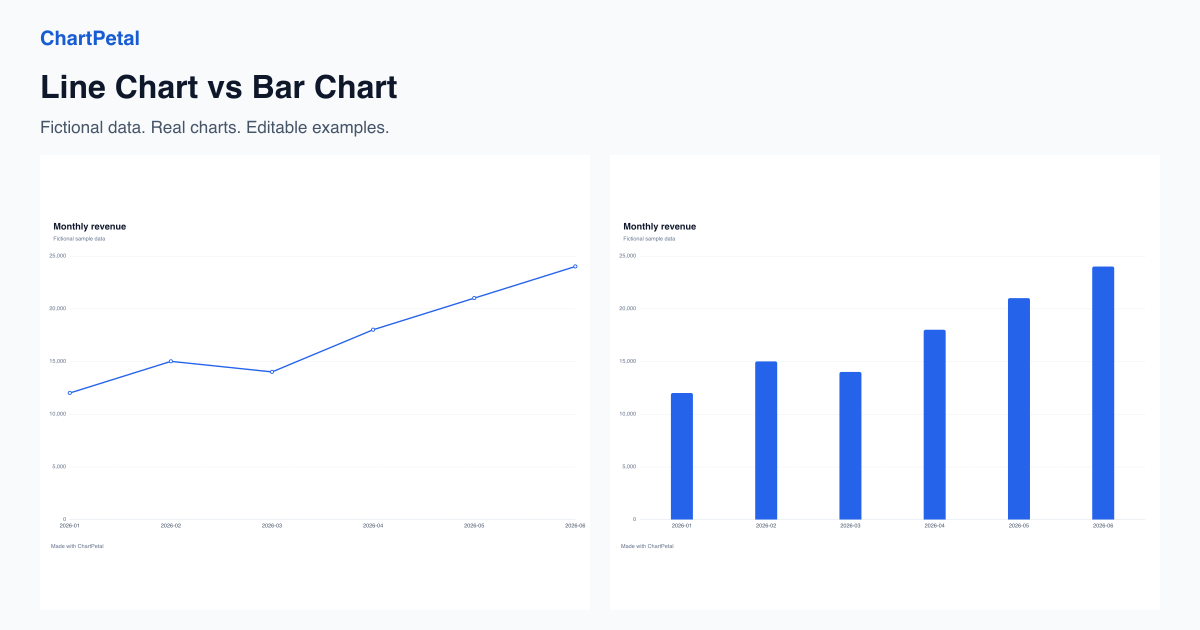
Compare the same monthly sales as lines and bars. Learn how ordering, missing months and equal category spacing affect the story, then edit the sample.
Read the guideAggregation
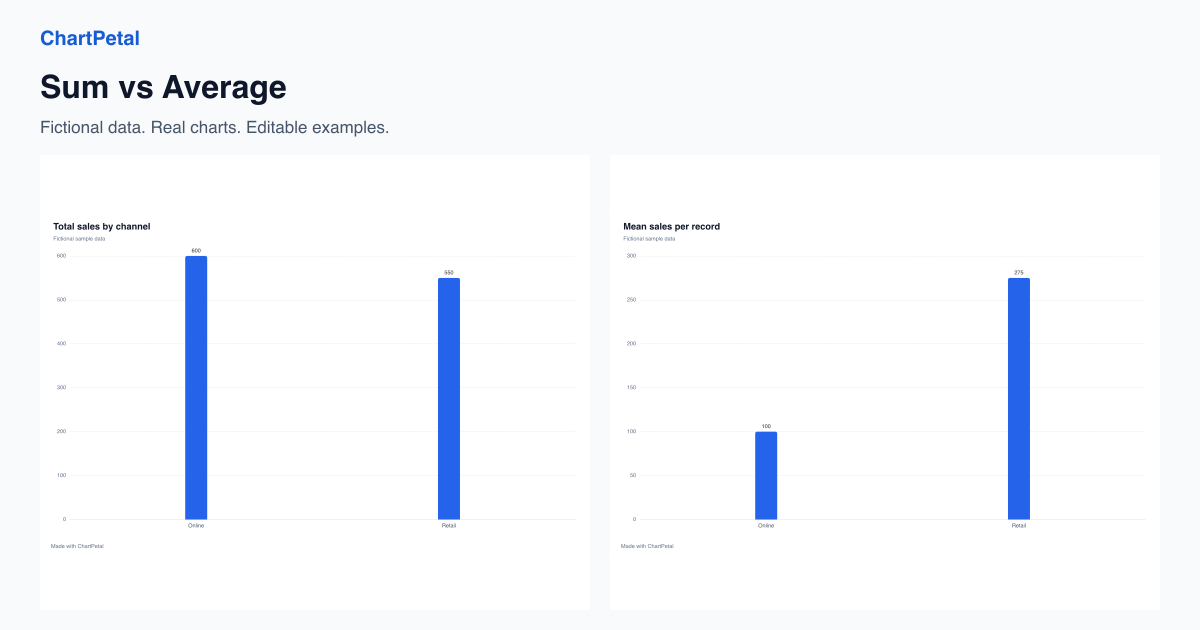
Use the same eight sales records to compare total sales and mean sale size. See why group size changes rankings and reproduce Sum and Mean in ChartPetal.
Read the guideDistributions
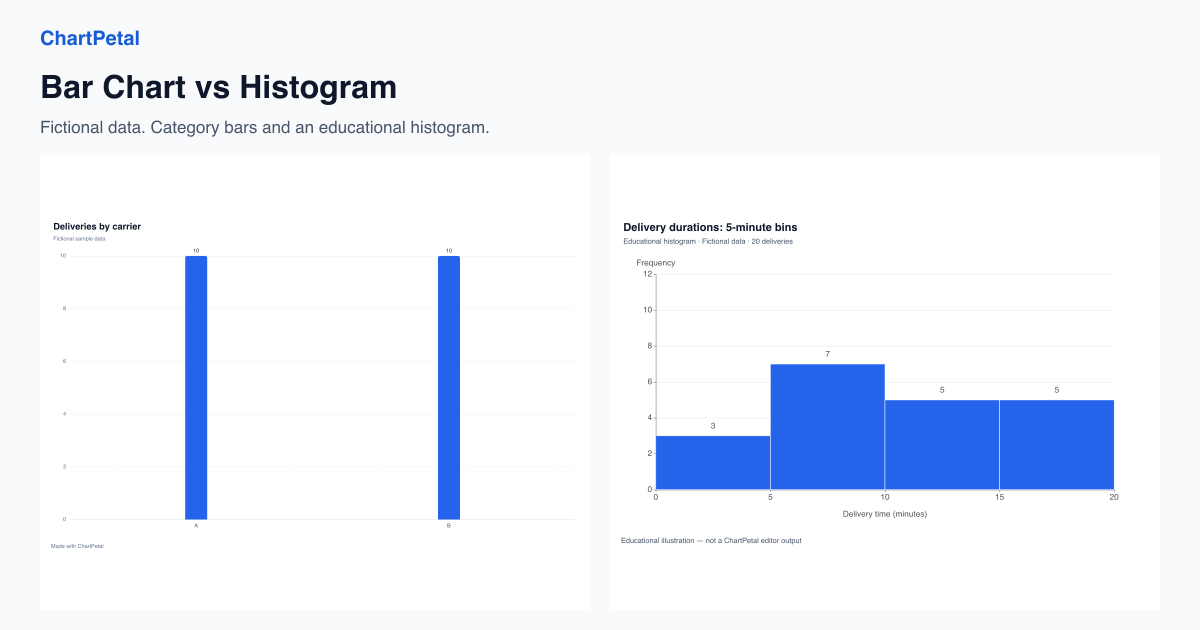
Compare category counts with a numeric distribution using twenty fictional deliveries. See five- and ten-minute bins and learn ChartPetal's pre-binned bar workflow.
Read the guide