
Chart choice
Line Chart vs Bar Chart: Examples and When to Use Each
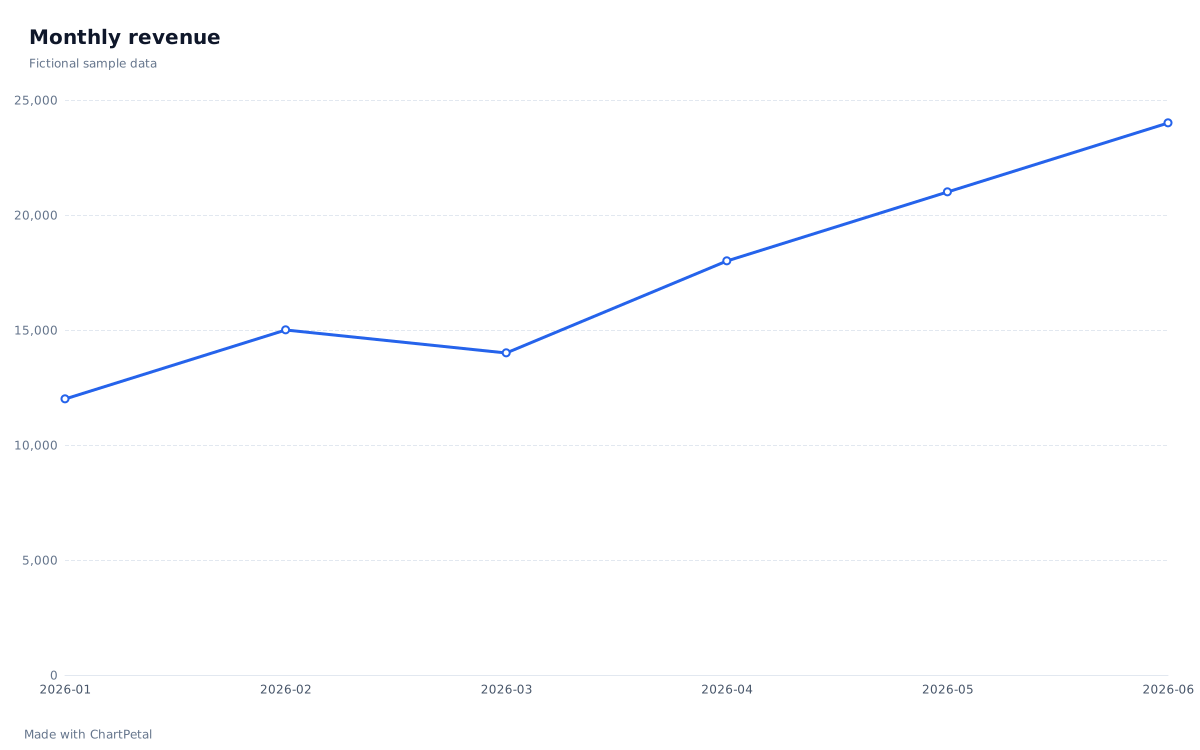
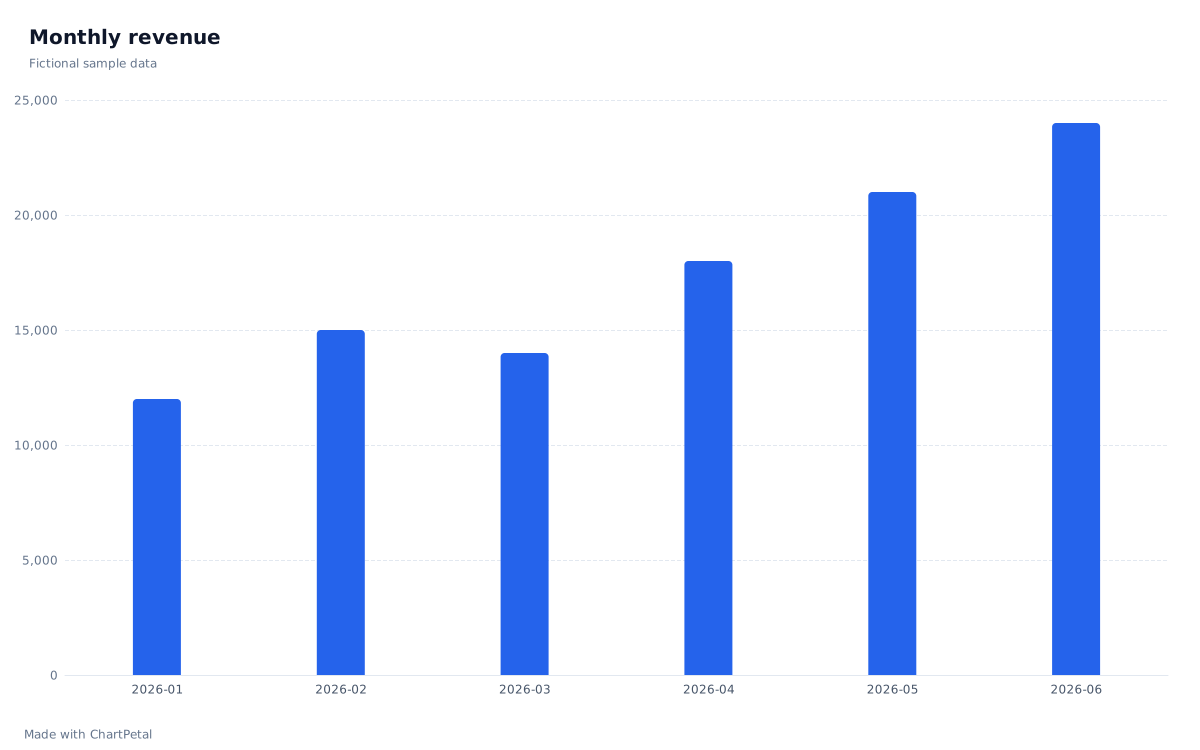
A line emphasizes how a measure changes through an ordered sequence. Bars make individual amounts easy to compare. Monthly sales can support either view: decide whether your reader needs the pattern over time or the amount in each month.
Follow the monthly pattern
Compare each month's amount
In this guide
One sales table, two useful questions
These six fictional months rise from 12,000 to 24,000 units overall, with a dip from 15,000 in February to 14,000 in March. The line makes that dip and recovery easy to trace; the bars emphasize each month's amount. Neither view proves why sales changed. Both use the exact table below, with one row per month and no aggregation.
| Month | Revenue |
|---|---|
| 2026-01 | 12,000 |
| 2026-02 | 15,000 |
| 2026-03 | 14,000 |
| 2026-04 | 18,000 |
| 2026-05 | 21,000 |
| 2026-06 | 24,000 |
A line needs a meaningful order
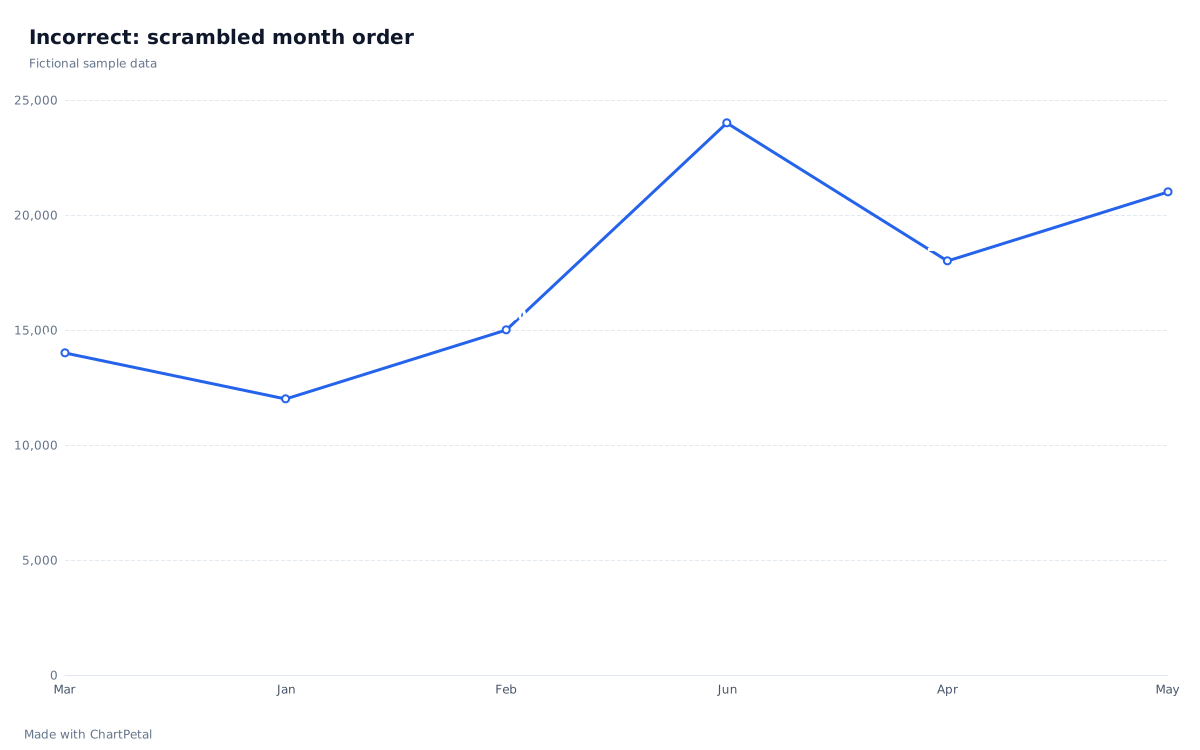
The intentionally unsuitable chart below connects text labels in the order Mar, Jan, Feb, Jun, Apr, May. It creates a zigzag that is not a time trend. Fix it by converting those labels to complete YYYY-MM dates in your source and reviewing the Month field as Date. The corrected chart at the top orders January through June. Sorting month names alphabetically would not fix the calendar order.
Unordered labels such as Online and Retail have no natural path between them. Use bars to compare those categories rather than implying a progression. In ChartPetal, dates and numeric X values sort automatically; text categories retain input order unless you change Order. Verify the field type instead of assuming a label that looks like a date is handled correctly.
Incorrect: month names kept in scrambled input order
A missing month is not a zero
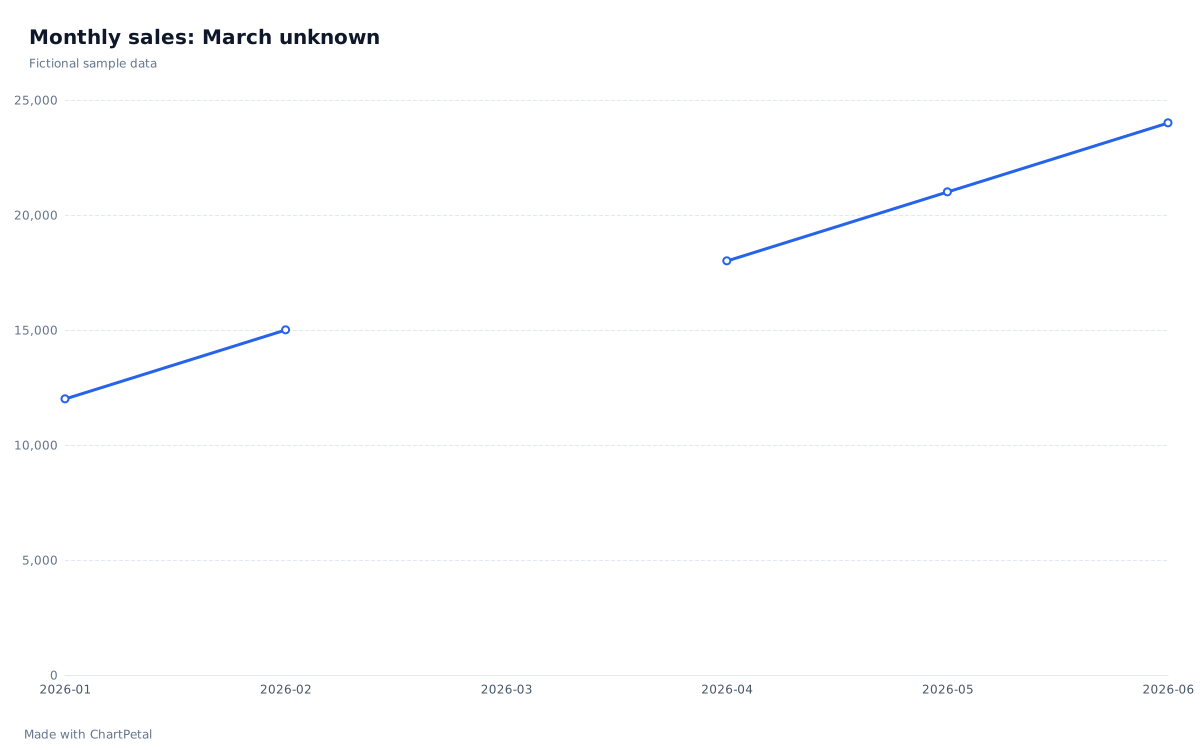
If March is unknown, keep a row for 2026-03 and leave its numeric value blank. The gap example below uses that table: ChartPetal's Line view keeps the March label and breaks the line instead of connecting across the missing value. A zero would claim there were no sales. Deleting the entire March row would remove the category and allow February and April to be joined. The CSV and preset for this illustration are available below.
The editor uses equally spaced category positions, even when X is a date. It does not insert absent months or size horizontal gaps by elapsed days. Use a complete, regular time grid for this workflow. For irregular observations, prepare an appropriate regular summary first, or use a tool with a true elapsed-time axis. Do not read the slope here as a rate per day.
March retained, value unknown
| Month | Revenue |
|---|---|
| 2026-01 | 12,000 |
| 2026-02 | 15,000 |
| 2026-03 | — |
| 2026-04 | 18,000 |
| 2026-05 | 21,000 |
| 2026-06 | 24,000 |
Reproduce the comparison in ChartPetal
Open the monthly sales preset: Month is X, Revenue is Values, Line is selected and Aggregation is None. Switch to Bar to compare the same six values. This complete table works in both views; the separate blank-March example is for Line, because a bar with a missing value requires correction or explicit row exclusion. Use Review field types to check dates and numeric amounts before creating your own chart.
Download the CSV, replace the months and amounts in your spreadsheet, then import the saved file. Keep a consistent reporting period and unit. Save a project before replacing work you want to retain. Manual chart changes do not call AI or spend credits, and the source spreadsheet is not connected for live updates.