
AI Spreadsheet Visualization
Copy a table from Excel or Google Sheets, paste it into ChartPetal, and turn its values into an editable chart with AI suggestions.
Works with pasted table values. Direct XLSX uploads, formula calculation, and live spreadsheet connections are not included.
Fictional sample data
From spreadsheet cells to an editable chart
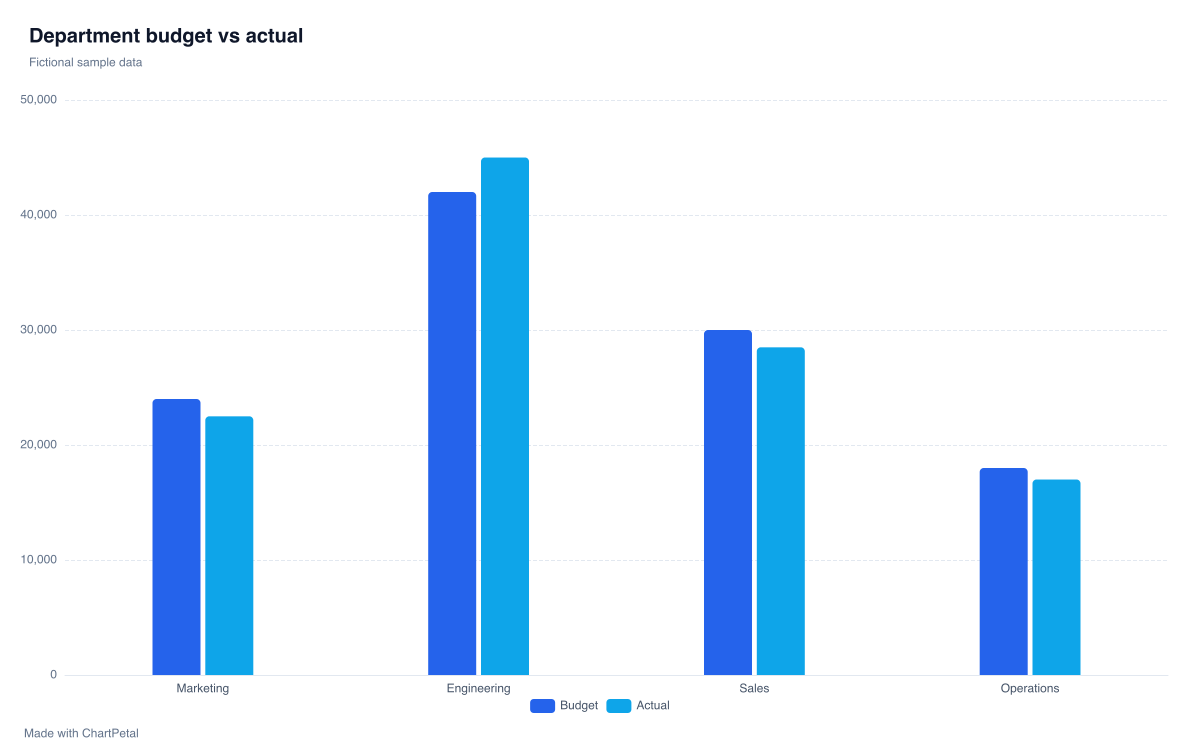
Compare Budget and Actual across departments using this fictional table. Copy the tab-separated sample into the workspace, or load it directly to edit the same two-series bar chart.
| Department | Budget | Actual |
|---|---|---|
| Marketing | 24000 | 22500 |
| Engineering | 42000 | 45000 |
| Sales | 30000 | 28500 |
| Operations | 18000 | 17000 |
HOW TO USE THIS TOOL
How to visualize spreadsheet data with AI
Copy a rectangular range
In Excel or Google Sheets, select the cells you need, including the header row, and copy them.
Paste and review
Paste into the table input and parse it. Check that tabs separate columns, rows align, and numeric fields have the right format.
Choose your starting point
Select the chart fields manually or request an optional AI suggestion with available credits. Review the configuration before applying it.
Make it your chart
Adjust the values, labels and palette. Download a free PNG with attribution or save an editable project for later.
Copy data from Excel or Google Sheets
In Excel, select a rectangular range with its column headers, copy it, and paste into the workspace input. Parse the table, then check the columns and displayed values.
In Google Sheets, select and copy cells in the sheet grid, then paste into the same input. You do not need to connect a Google account. If the paste has only one column, copy cells from the grid rather than a cell’s editing text, or download a CSV and use the CSV importer.
What transfers when you paste a table
The importer reads plain text values separated into rows and columns. It does not preserve spreadsheet colors, cell styles or chart formatting. Header names transfer when the header option is enabled.
Formula results copied as displayed values can be plotted, but formulas are not calculated by ChartPetal. Changing the original workbook or sheet does not update the imported table; paste the revised range again when needed.
Prepare your spreadsheet for visualization
Use one header row with unique names and avoid merged cells. Keep the same number of columns in every row, and leave subtotal rows out if you plan to calculate totals from individual records.
Review dates in YYYY-MM or YYYY-MM-DD format, and check currency, thousands separators and percentage settings. Use up to 5 MB, 10,000 data rows and 2–30 columns. Missing values are not automatically filled in.
Related guides
- Budget vs Actual Chart Example Compare Budget and Actual for four fictional departments. Inspect the difference, copy the table and open an editable two-series chart.
- Sum vs Average: Which Should You Use in a Chart? Use the same eight sales records to compare total sales and mean sale size. See why group size changes rankings and reproduce Sum and Mean in ChartPetal.
AI Spreadsheet Visualization FAQ
Can I create charts from Excel data?
Yes. Copy a rectangular range of cells from Excel, including headers, and paste it into the table input. Review the parsed columns and number formats, then create a chart manually or request an optional AI suggestion. ChartPetal works with the copied values.
Can I use data from Google Sheets?
Yes. Copy cells from the Google Sheets grid and paste them into ChartPetal. This imports the copied values without a Google account connection. It does not create a live connection or synchronize later changes.
Can I upload an XLSX file directly?
No. Direct XLSX uploads are not supported. Copy the cells you need from Excel and paste them here, or export the sheet as a UTF-8 CSV and use the CSV upload tool.
Are spreadsheet formulas recalculated?
No. ChartPetal reads pasted text values and does not run a spreadsheet formula engine. Copy the displayed results from your source spreadsheet. If the source calculation changes, copy and paste the updated values again.
Will changes to my spreadsheet update the chart automatically?
No. The pasted table is a separate snapshot. To use changes from Excel or Google Sheets, paste the updated range and review the fields again. There is no automatic synchronization or live spreadsheet connection.
Why did my pasted data appear in one column?
The copied text may not contain column delimiters. Select a rectangular range in the spreadsheet grid, rather than text inside a single cell, and copy it again. Columns should be separated by tabs. You can use Copy sample table to check the workflow, or export the source as CSV and upload that file.