
Aggregation
Sum vs Average: Which Should You Use in a Chart?
Sum answers how much a group contributed in total. An arithmetic mean answers how much per included numeric record. Those are different questions: a channel can lead on total sales and trail on average sale size without either calculation being wrong.
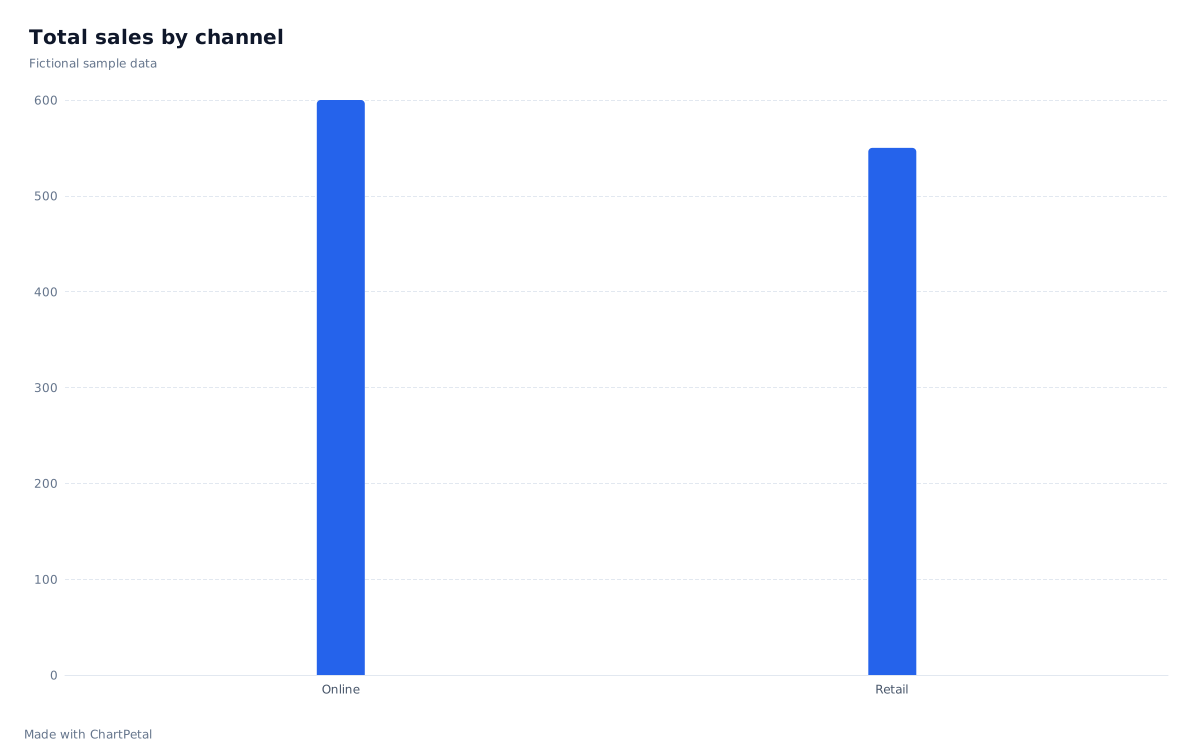
Sum: total sales by channel
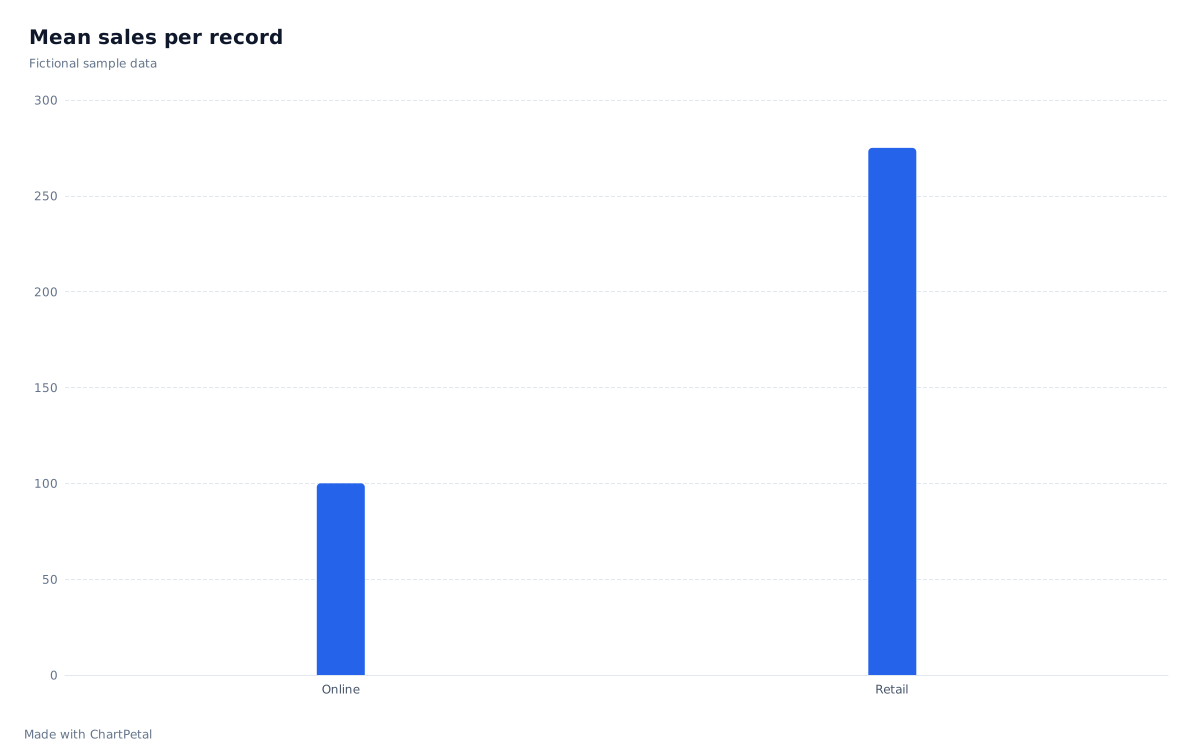
Mean: sales per record by channel
In this guide
Start with records at the same level
Every row below represents one fictional completed sale, in the same unit and reporting period. Online has six records: 80, 100, 120, 90, 110 and 100. Retail has two: 250 and 300. Repeated Channel values are intentional; they are the groups we want to summarize. These are individual sales, not already-averaged channel summaries.
| Channel | Amount |
|---|---|
| Online | 80 |
| Online | 100 |
| Online | 120 |
| Online | 90 |
| Online | 110 |
| Online | 100 |
| Retail | 250 |
| Retail | 300 |
Explain the ranking change
Online totals 600 across six sales, so its mean is 600 ÷ 6 = 100. Retail totals 550 across two sales, so its mean is 550 ÷ 2 = 275. Online leads in total sales by 50; Retail leads in average sale size by 175. More records explain how the group with the lower average can still have the larger total. These figures do not identify profit, customer value or a cause of the difference.
Across all eight records, the mean is (600 + 550) ÷ (6 + 2) = 143.75. Averaging the two displayed group means gives (100 + 275) ÷ 2 = 187.5, which gives each channel equal weight rather than each sale. If you only have summarized means, retain the group counts to compute a weighted mean before importing the result; the chart's Mean option does not infer hidden weights.
Check what counts in the denominator
For Sum and Mean, ChartPetal ignores blank numeric values within each group. A numeric zero is included. Replacing a missing sale amount with zero therefore changes the mean, while leaving a group entirely blank produces no numeric result. Invalid number text must be corrected or explicitly excluded. Review the missing and excluded row counts alongside the chart.
Count counts accepted rows in each group, including rows whose selected value is blank; it is not a count of non-empty numeric values. In this complete sample Count would show six Online and two Retail records. With incomplete data, do not divide Sum by Count and assume that it equals Mean. Distinct customers, medians and weighted means are not options in this chart's aggregation menu.
Switch Sum and Mean without changing the data
Open the sales preset. It selects Bar, Channel for Category / X, Amount for Values and Sum for Aggregation. Change Aggregation to Mean to reproduce the second chart, then back to Sum. The UI calls the arithmetic average Mean. None would reject the repeated Channel labels; choose an explicit aggregation. Update the title to describe the selected measure before sharing the chart.
Use Sum for additive amounts measured in consistent units. Do not add percentages just because they share a column: the editor blocks Sum for percentage-formatted data. Mean is not automatically a valid rate either; unequal denominators require a weighted calculation from the source data. The examples here use raw amounts, so no rate or weighting assumption is hidden.