
Chart choice
Pie Chart vs Bar Chart: Which Should You Use?
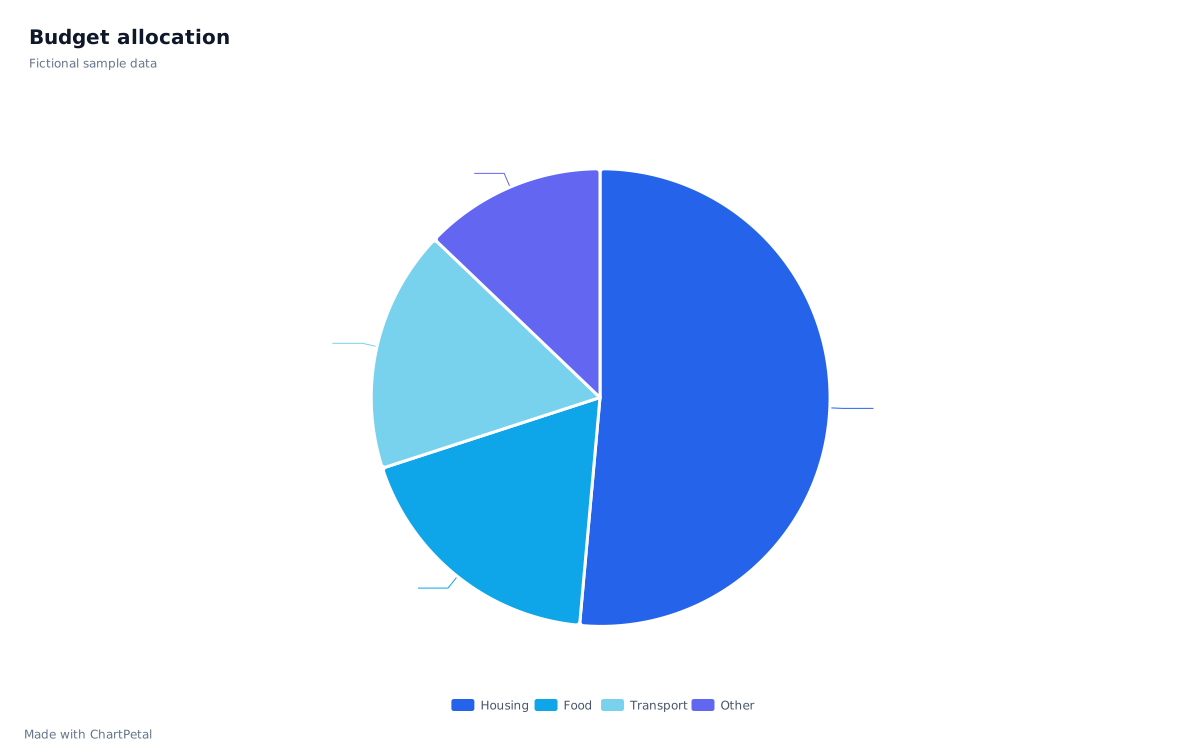
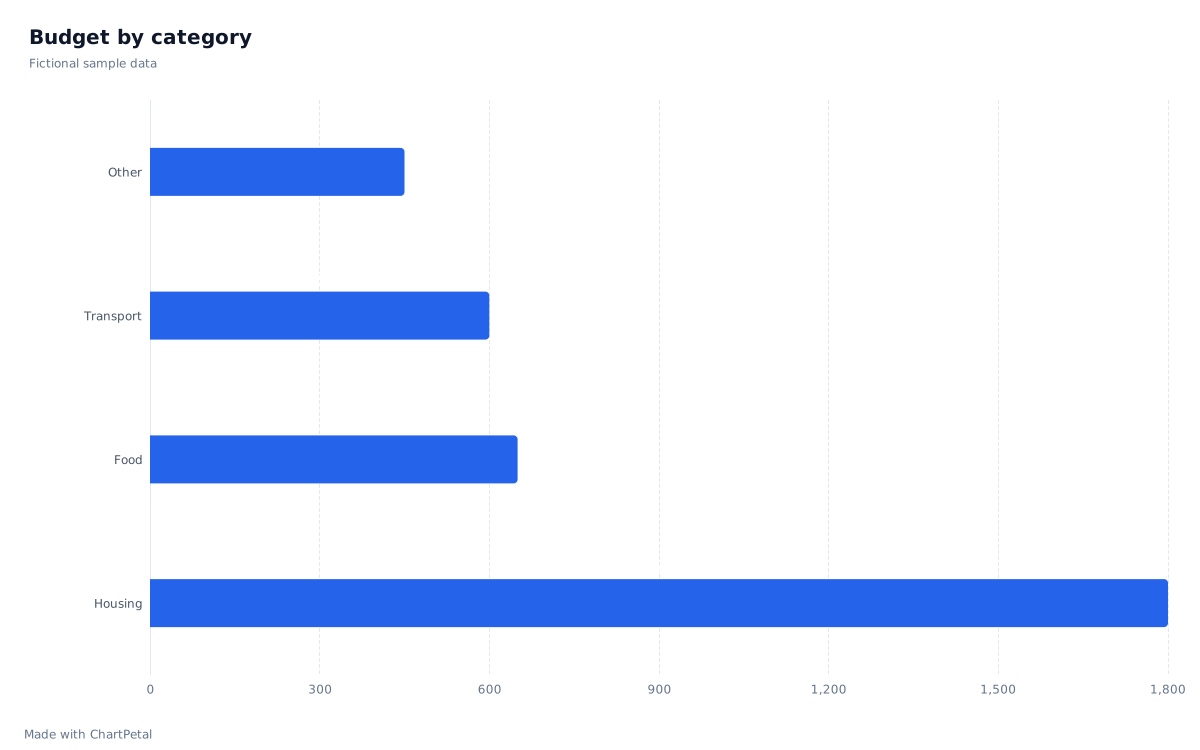
Choose a pie chart when the question is about shares of one complete total. Choose a bar chart when the question is about comparing amounts. The numbers below never change; only the view changes, so you can judge what each chart makes easier to see.
One budget, shown as a pie
The same budget, shown as bars
In this guide
One table, two views
Our fictional budget contains Housing 1,800, Food 650, Transport 600 and Other 450, totaling 3,500 units. Both charts are rendered by ChartPetal from these four rows. Housing is the largest category in either view; Food and Transport are close in size. The table provides exact values when the picture alone is not enough.
| Category | Amount | Share of total |
|---|---|---|
| Housing | 1,800 | 51.43% |
| Food | 650 | 18.57% |
| Transport | 600 | 17.14% |
| Other | 450 | 12.86% |
| Total | 3,500 | 100% |
Use bars to compare categories precisely
Food exceeds Transport by 50 units, or 1.43 percentage points of this total. That small gap is less obvious between slices than between bars aligned to the same baseline. If a reader needs to rank categories or compare a close pair, use bars and keep the exact numbers available.
For this non-negative dataset, the bar scale starts at zero. Truncating it near 600 would make a 50-unit difference look disproportionately large. Keep units consistent, label the axis and use the table for exact comparisons. The chart editor keeps zero in the value-axis range for bar charts.
More categories, small gaps and negative values
As categories increase, pie labels and similar slices become harder to follow. ONS guidance recommends a small set of categories and favors bars when slice sizes are close. If you combine small categories into Other, keep the total unchanged and explain what is included. ChartPetal accepts up to eight positive pie slices; that is a product limit, not a recommendation to use all eight.
A negative amount is not a slice of a positive whole. If your data includes refunds or a signed difference such as Actual − Budget, use an appropriate bar comparison with clear labels. Do not turn negatives into absolute values just to make a pie render: that changes the question and the total. ChartPetal rejects negative pie values.
Try both views with the same data
Open the budget example and select Use this sample. The pie opens with Category and Amount already chosen. In the editor, change the chart type to Bar and enable Horizontal bars to compare the same values. Return to Pie to inspect the allocation again. These manual changes do not call AI or use credits.
To test your own budget, edit the downloaded CSV or prepare a two-column table in a spreadsheet, then import it. Review field types and save an editable project if you want to return later. This is a visualization exercise, not a recommendation about how to allocate your money.