
Fictional sample data
Budget Pie Chart Example
Explore a fictional budget pie chart with source data, calculated percentages and a downloadable CSV. Open the same chart in the editor.
Opens an editable preset. No AI request or credit charge.
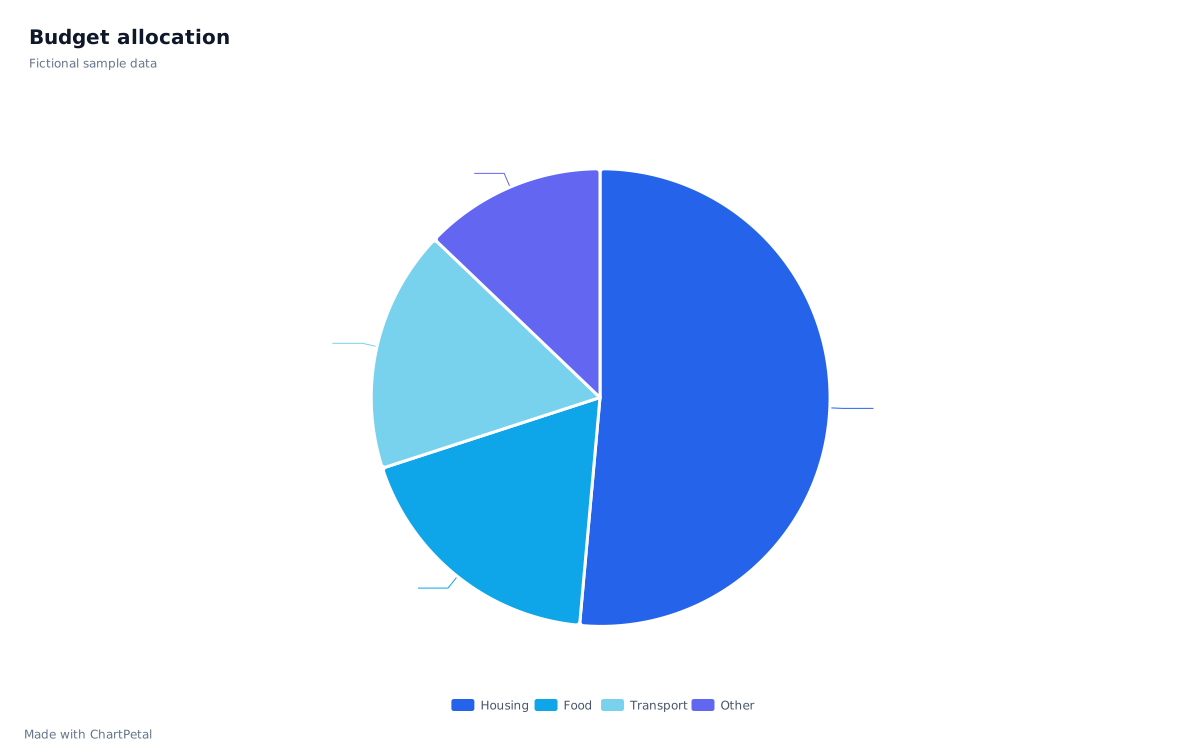
The source data
| Category | Amount | Share of total |
|---|---|---|
| Housing | 1,800 | 51.43% |
| Food | 650 | 18.57% |
| Transport | 600 | 17.14% |
| Other | 450 | 12.86% |
| Total | 3,500 | 100% |
Amounts are illustrative units, not a recommended spending plan.
Read the budget as parts of one total
The four categories sum to 3,500 units. Housing accounts for 1,800, or 51.43% of the total. Each percentage is Amount ÷ 3,500 × 100, rounded to two decimal places in the table. The chart uses the original amounts, not the rounded percentages.
Replace the amounts and categories
Use this sample opens the exact data and pie configuration in the chart editor. To replace the data, download the CSV, edit its Category and Amount cells in a spreadsheet, then upload the saved CSV. You can also clear the workspace and paste a revised two-column table. Save your existing project before replacing it.
After importing your revised table, choose Category for X and Amount for Values, select Pie and check the labels. Keep categories distinct and amounts positive. ChartPetal supports two to eight positive pie slices; fewer clearly named categories are usually easier to explain. There is no spreadsheet cell editor inside the chart controls.
When a bar chart is the clearer choice
Food is 650 and Transport is 600: the difference is only 50 units. A bar chart makes that gap easier to compare along a shared axis. Use the linked guide to see this exact budget in both forms.
This example visualizes a plan you provide. It does not connect bank accounts, track transactions, recommend a budget or provide personal financial advice.