
AI Chart Generator
Upload a CSV or TSV, or paste a table. Review your data, get an AI chart suggestion, and refine an editable chart for your report.
Loading your workspace… CSV, TSV and pasted tables are supported.
Fictional sample data
Examples with a question to answer
Real ChartPetal output, ready to edit. Load fictional data and chart settings without AI or credits. Preview chart labels are in English.
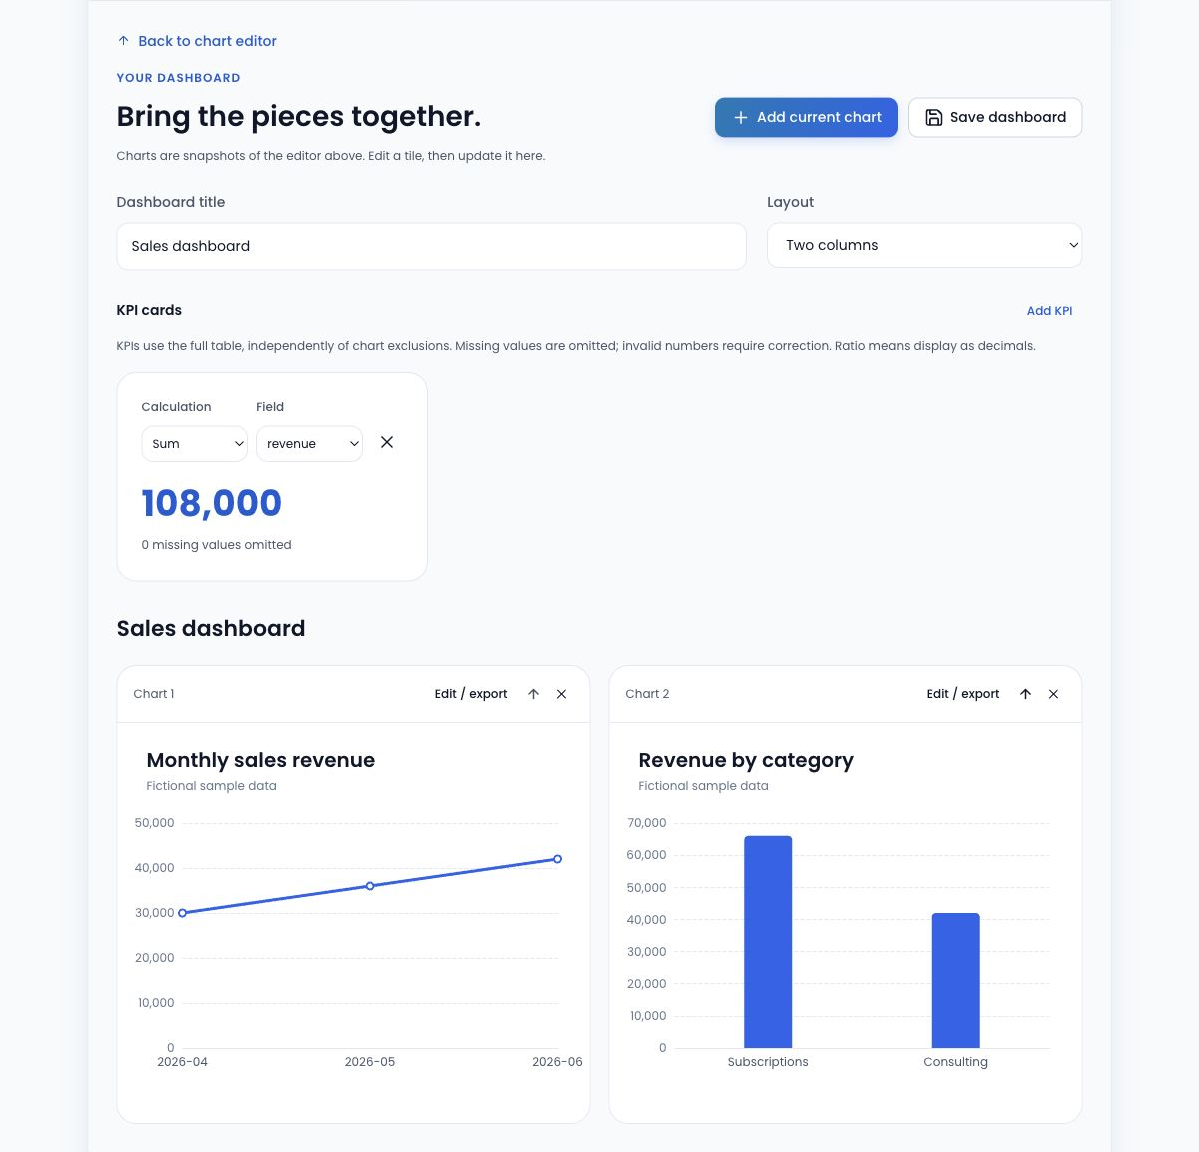
Sales dashboard
Explore revenue trends, category totals and a summary metric together.
View the sales example’s source data and workflow
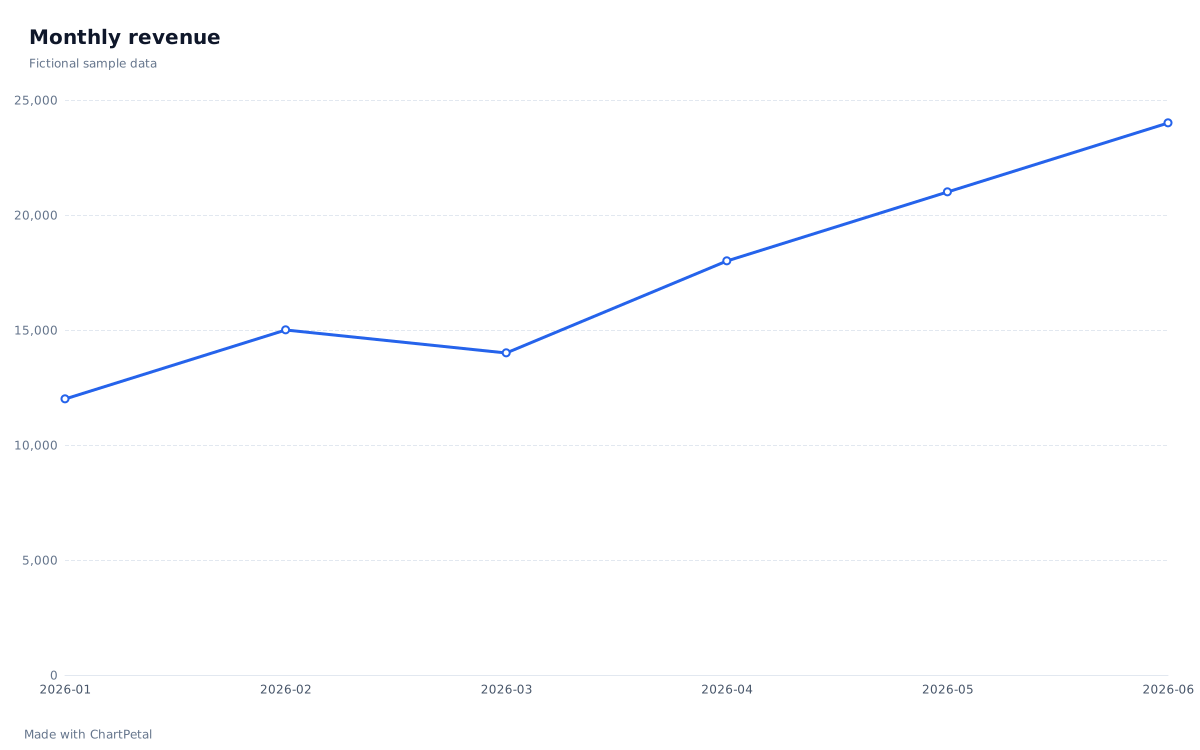
The sales preview uses the six rows below and a preset line chart; loading it needs no AI or credits. Optional AI suggests chart settings after you review the data. You can change chart type, fields, aggregation, title and colors, then export the individual chart or save its project.
| Month | Revenue |
|---|---|
| 2026-01 | 12,000 |
| 2026-02 | 15,000 |
| 2026-03 | 14,000 |
| 2026-04 | 18,000 |
| 2026-05 | 21,000 |
| 2026-06 | 24,000 |
AI CREDITS, ON YOUR TERMS
Simple pricing for AI credits and chart exports
Buy credits when you need them. One payment, no expiry, no subscription.
Starter
For a presentation, a class project or your first report.
$5.00
One-time payment · No auto-renewal
50 AI credits
Enough for 50 successful AI suggestions
$0.10 per credit
A little room to try your next idea.
Included with every pack
- Purchased credits never expire
- SVG + PNG up to 4,000 px
- Transparent backgrounds · no attribution
Creator
RecommendedFor regular reports, content creation and recurring chart work.
$12.00
One-time payment · No auto-renewal
150 AI credits
Enough for 150 successful AI suggestions
$0.08 per credit
20% lower cost per credit than Starter
Included with every pack
- Purchased credits never expire
- SVG + PNG up to 4,000 px
- Transparent backgrounds · no attribution
Studio
Best valueFor frequent chart creation across reports and larger projects.
$29.00
One-time payment · No auto-renewal
500 AI credits
Enough for 500 successful AI suggestions
$0.058 per credit
42% lower cost per credit than Starter
Included with every pack
- Purchased credits never expire
- SVG + PNG up to 4,000 px
- Transparent backgrounds · no attribution
Applicable taxes are calculated at checkout.
HOW TO USE THIS TOOL
How to create a chart with AI
Add your data
Upload a CSV or TSV, or paste a table. Include unique column headers, or turn off the header option to create numbered columns.
Review your fields
Check column types, number formats and missing values. Choose the fields and any summary calculation for your chart.
Get an AI suggestion
With the AI service enabled and credits available, request a starting point for the chart you are editing. Review the suggestion before applying it.
Refine and export
Adjust the chart type, title, fields and palette. Download a free 1,200 px PNG with attribution, or save an editable project to reopen later.
An AI graph maker for everyday data
Choose a chart that answers your question. These five chart types are available in the editor.
Bar
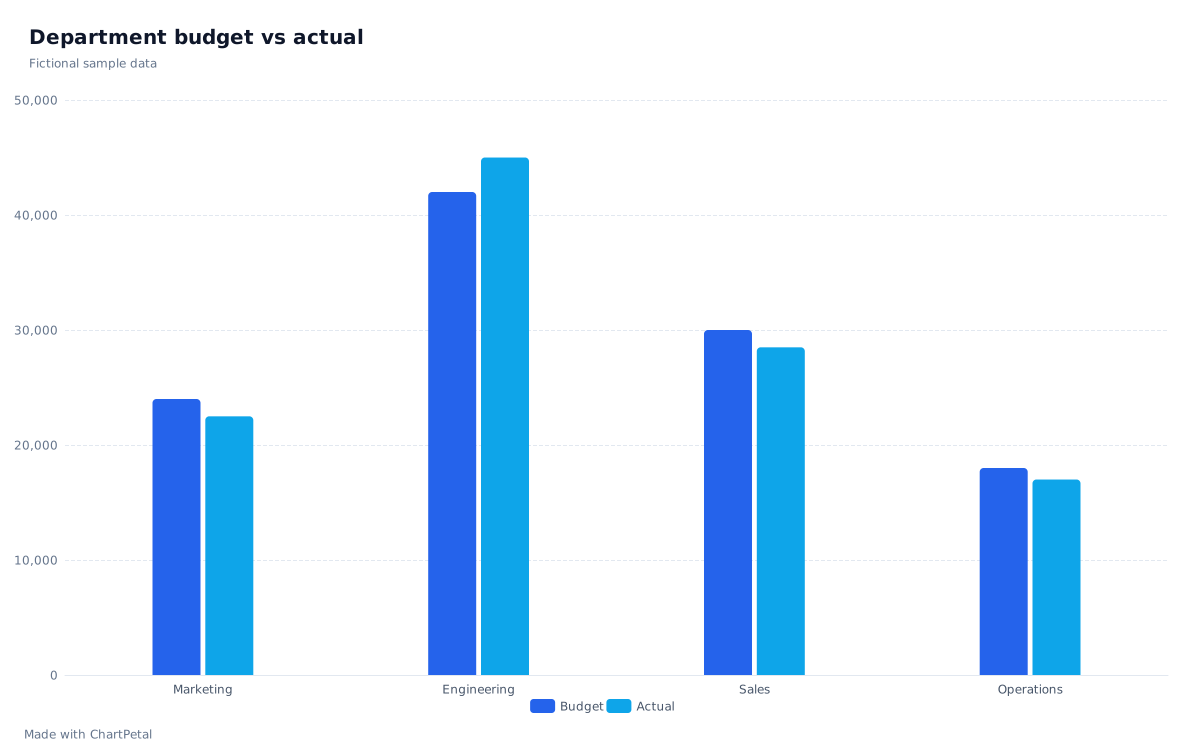
Compare amounts across categories, such as revenue by department.
Line
Follow change over time, such as monthly revenue.
Area
Show the shape and magnitude of a non-negative trend with one series.
Pie
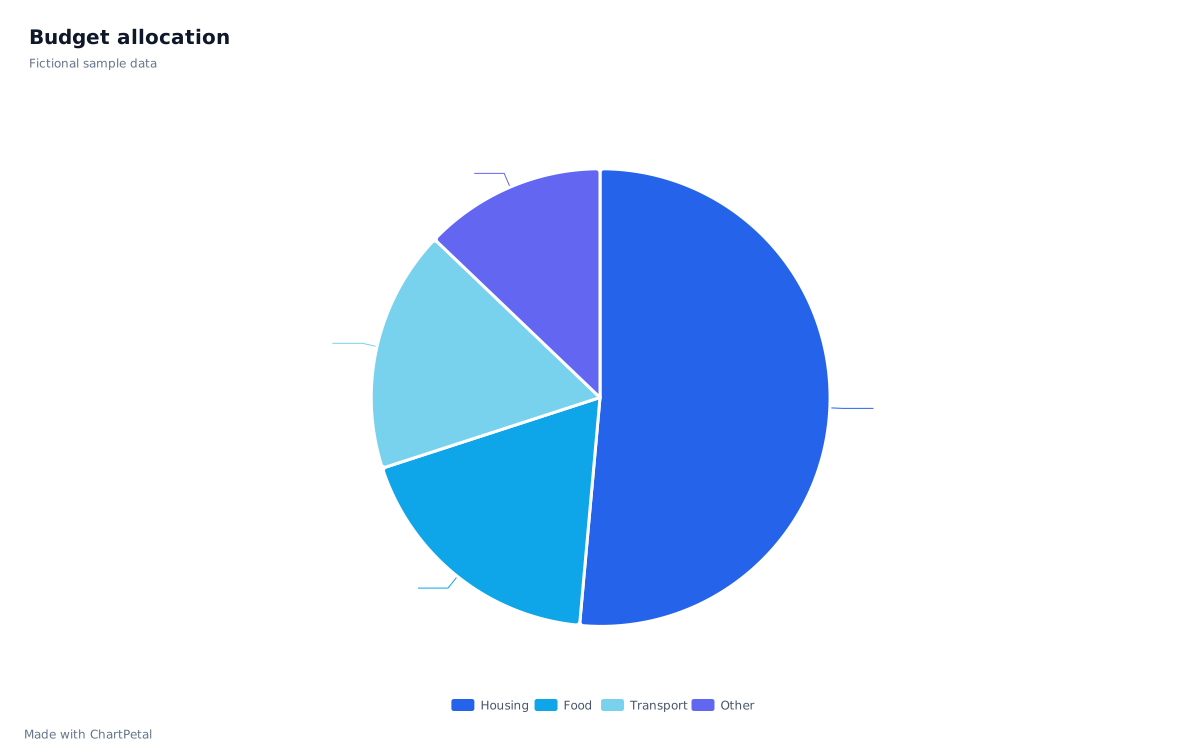
Compare parts of a whole with two to eight positive categories.
Scatter
Explore the relationship between two numeric fields, without aggregation.
Start with your data
- AI CSV visualization Import a file and review columns, number formats and summaries.
- AI spreadsheet visualization Copy values from Excel or Google Sheets into an editable chart.
- AI dashboard generator Arrange several charts and KPI cards from one table.
Related guides
- Pie Chart vs Bar Chart: Which Should You Use? Compare a pie chart and a bar chart made from the same budget data. Learn when to show a share, compare categories or handle close values and negatives.
- Line Chart vs Bar Chart: Examples and When to Use Each Compare the same monthly sales as lines and bars. Learn how ordering, missing months and equal category spacing affect the story, then edit the sample.
AI Chart Generator FAQ
What does the AI chart generator do?
AI suggests a configuration for the chart you are editing, using your field names, field types, row count and instruction. Review and apply the suggestion, then keep editing. It does not analyze your row values, forecast results or automatically build an entire dashboard.
Can I create charts without using AI?
Yes. Import, edit and export charts manually without an account. AI suggestions require sign-in and available credits. Free accounts receive 10 AI credits per UTC calendar month. Each successful suggestion uses one credit; failed generation releases the reserved credit.
What data can I use?
Use CSV, TSV or copied spreadsheet values, up to 5 MB, 10,000 data rows and 30 columns. Use two or more columns with non-empty, unique headers, or turn off the header option for numbered columns. Each chart supports up to 2,000 plotted points and five series.
Can I edit the chart after using AI?
Yes. You can change its chart type, category and value fields, summary calculation, sorting, title, subtitle, source and color palette. Legend, labels and chart-specific controls remain available. The AI suggestion is an editable starting point.
How can I export my chart?
Download a free 1,200 px PNG with attribution. Eligible purchased packs unlock SVG, PNG up to 4,000 px, transparent backgrounds and removal of attribution. Save an editable project separately to preserve your table and chart settings; a project file is not an image export or cloud backup.
What happens to my data when I use AI?
Table parsing, chart calculations and manual editing happen in your browser. If you consent to an AI request, field names, field types, row count and your instruction are sent through the service to the configured model. Row values are not included automatically. Do not put private row values in your instruction.